Blood Glucose Level Chart for Ketosis: What Are The Optimal Levels?

If you’re managing your health at home, understanding how your body works is already a powerful, proactive way of doing it. It can be overwhelming and it would be easier to find a blood glucose level chart for ketosis. Optimal fasting range for fasting glucose typically falls between 70-90 mg/dL to support the effective fat-burning activities while maintaining metabolic health.
This metabolic state creates an inverse relationship between glucose and ketones. This is where lower glucose levels signal your body to transition to using fat as its primary energy resource. Monitoring these levels become crucial for anyone following a ketogenic lifestyle, especially those who are managing diabetes or have weight loss goals. The key lies in understanding how ketosis affects your glucose patterns and what ranges indicate healthy metabolic function.
This article explores the relationship between blood glucose and ketosis. So you can have clear insights on how these two vital aspects of your metabolism interact with each other. You will know about the optimal levels, monitoring methods, and what to watch out for to ensure that your proactive efforts stay on track. This information aims to enable you to elevate your knowledge for better at-home glucose monitoring.
Key Insights:
-
Optimal fasting blood glucose in ketosis ranges from 70-90 mg/dL to support fat-burning and metabolic health
-
Ketones and glucose show an inverse relationship; as glucose drops, ketones rise to 0.5-3.0 mmol/L for nutritional ketosis
-
The Glucose Ketone Index (GKI) helps track ketosis depth: aim for 3-9 for weight loss, calculated as (glucose in mmol/L) ÷ ketones
-
Monitor with glucometers or CGMs for personalized insights, especially important for managing diabetes or weight goals
-
Warning signs include fasting glucose >100 mg/dL (indicating loss of ketosis) or <60 mg/dL (hypoglycemia risk)
What Is Ketosis and How Does It Affect Blood Glucose?
Ketosis represents a metabolic state where your body burns fat for fuel instead of utilizing carbohydrates. This leads to lower blood glucose as glucose stores become depleted. This metabolic shift typically drops glucose levels to about 70-90 mg/dL range while ketones increase to therapeutic levels.
When you restrict your body of carbohydrates to less than 50 grams per day, your liver will begin converting fatty acids into ketone bodies, specifically the following:
-
Beta-hydroxybutyrate (BHB)
-
Acetoacetate
-
Acetone
These ketones serve as an alternative fuel source for your brain and muscles, reducing your body’s dependence on glucose. This relationship between ketosis and blood glucose involves several mechanisms:
-
Glycogen depletion: Your liver and muscle glycogen stores become exhausted within 24-72 hours of carb restriction
-
Gluconeogenesis regulation: Your liver only produces essential glucose from proteins and fats
-
Insulin sensitivity improvement: Lower insulin levels allow for better glucose control
-
Fatty acid oxidation: Increased fat burning reduces the need for glucose as primary fuel
During nutritional ketosis, your brain can derive as much as 70% of its energy requirements from ketones rather than glucose. This metabolic flexibility explains why glucose levels naturally decrease without causing impairment in cognition.
For patients with insulin resistance or type 2 diabetes, ketosis often leads to improved glucose control. Studies indicate that sustained ketosis can lower the HbA1c levels by approximately 1-2% over a period of 6 months. This demonstrates significant metabolic improvements.

What Causes Changes in Blood Glucose During Ketosis?
Several factors influence blood glucose fluctuations during ketosis, with dietary composition playing the primary role in determining your levels.
Dietary factors affecting glucose levels:
-
Carbohydrate intake of more than 50 grams every day can result in glucose spike, which exceeds the ketosis range
-
Protein consumption of more than 1.6 grams per kilogram of body weight may convert to glucose through gluconeogenesis
-
Hidden carbs (sauces, seasonings, and processed foods often contain unexpected sugars)
-
Extended fasting periods typically lower your glucose levels

Exercise impacts on glucose levels:
-
Resistance training can temporarily raise glucose levels because of release of counterregulatory hormones, which acutely increase your levels
-
Cardio exercise may lower glucose levels during and after
-
High-intensity intervals may cause brief glucose spikes followed by significant drops
Stress and sleep effects:
-
Chronic stress can elevate morning glucose due to cortisol elevation, which is the stress hormone
-
Sleep deprivation leads to poor sleep quality, which often increases glucose
-
Illness or infection can temporarily increase glucose even while maintaining ketosis
Hormonal influence:
-
Dawn Phenomenon is an episode for patients with diabetes when their glucose levels increase in the early morning hours
-
Menstrual cycle is associated with hormonal fluctuations, which may affect glucose levels in women
-
Thyroid function also affects glucose levels. Hypothyroidism, for example, slow down glucose clearance and affect ketone production
If you are able to understand these factors and variables, you can identify patterns for your glucose readings and adjust your approach accordingly. You can keep a detailed log of your food intake, stress levels, exercise, and glucose measurements at-home. This should give you valuable insights on your own response.
How Is Ketosis Diagnosed Through Glucose Levels?
Testing fasting glucose levels offer one indicator of ketosis entry, with readings consistently 90 mg/dL often mark the metabolic transition. However, glucose testing alone cannot confirm the presence of ketosis, you need ketone measurements for definitive diagnosis.
Primary testing methods:
-
Blood glucose meters: Standard glucometers offer accurate glucose readings
-
Continuous glucose monitors (CGMs)
-
Laboratory blood draws
-
Urine ketone strips or at-home urine strips, which may detect ketones but may not be reliable as ketosis worsens
Optimal testing protocols:
-
Fasting measurements (8-12 hour fasting)
-
Post-meal timing
-
Consistency
-
Dual testing
Blood Glucose Level Chart for Ketosis
|
Level |
Interpretation |
|
|
Fasting glucose |
70-100 mg/dL 100-125 mg/dL |
Normal for general population Pre-diabetic; requires medical evaluation |
|
Ketones |
Ketosis with fasting glucose of 70-90 mg/dL |
|
|
High-Levels |
>126 mg/dL glucose |
Diabetic range; measured in two separate occasions |
Most insurance companies cover basic glucose testing supplies but if you want to use at-home urine strip testing, you might want to check with your insurance company first. There are also many pharmacies that offer free glucose screenings as part of their marketing campaign. This provides an entry point for people who want to start tracking their blood glucose.
What Are Normal Blood Glucose Levels in Ketosis?
Normal fasting blood glucose in ketosis typically ranges from 70-90 mg/dL (3.9-5.0 mmol/L). Post-meal levels are different but remain stable at 120 mg/dL, which is important to ensure fat-burning capacity. These ranges represent optimal metabolic function while avoiding both high levels and low levels of glucose.
Nonetheless, it is important to note that individual variations also exist, which is based on several factors like:
-
Metabolic health history
-
Current medications
-
Activity levels
-
Genetic predisposition
-
Age
-
Athletic status
Some people are able to maintain healthy ketosis with glucose levels that are slightly outside these ranges, emphasizing the importance of personalized monitoring.

Frequency of Monitoring
-
Initial daily monitoring of blood glucose and ketone levels during the initial adaptation to ketosis may help determine when nutritional ketosis is achieved
-
Monitoring can then shift to every few days or weekly once ketosis has been established
-
If you introduce new foods into your regimen, frequent or situational monitoring may be required
-
Opt for continuous glucose monitoring (CGMs) if you feel the need for constant glucose profiling, which is helpful to identify carbohydrate tolerance and triggers
Key Practices to Consider
-
Test at the same time every day for consistency
-
Blood testing for ketones is most accurate, compared to urine strips but the latter is cheaper and more convenient
-
There is no strict requirement for monitoring but regular checks at the start of a ketogenic intervention can be useful for motivation and precision
-
If nutritional ketosis is the goal for medical indications, more frequent or clinical monitoring may be required
That said, consistency bears more weight than perfecting a schedule of monitoring. If you maintain your personal optimal glucose range, it offers more metabolic benefits because it allows more room for normal daily variations.
What Are Fasting Glucose Levels in Ketosis?
Fasting glucose levels serve as the primary indicator of ketosis depth and metabolic efficiency, with different ranges corresponding to various stages of adaptation.
For ketosis, the fasting glucose levels should be between 70-90 mg/dL as previously mentioned. However, this value may be slightly higher or lower especially following a ketogenic diet.
People who have been in ketosis for a long time or are really strict about it (particularly for more than a year) may notice that their fasting glucose levels are a little higher than those of people who aren't in ketosis. This is called "adaptive glucose sparing." When this happens, muscular tissue mostly uses fat for energy, leaving only a small amount of glucose for organs that need it. This makes fasting glucose levels higher but still low after eating. People think of this as a normal change in the body, not as a sign of insulin resistance.
What Are Post-Meal Glucose Levels in Ketosis?
After eating, blood sugar levels in nutritional ketosis usually rise less than 30 mg/dL over the fasting baseline within 1–2 hours, so typical readings are between 100 and 120 mg/dL for those whose fasting glucose is between 70 and 90 mg/dL.
For people who have adapted to the keto diet, keeping postprandial glucose levels below 30 mg/dL above baseline is thought to be the best way to keep ketosis stable and metabolic health. Meals on a well-planned ketogenic diet have very little carbohydrates, thus big spikes in glucose levels are rare. Most people have a small, short spike (usually peaking after 30–60 minutes) before going back to their normal levels within 2 hours.
Problematic post-meal signs:
-
Sustained spikes in more than 3 hrs suggest metabolic dysfunction, which require evaluation
-
Symptoms with normal readings may indicate hypoglycemia or other issues
-
Inconsistent patterns could suggest stress, illness, or medication effects
When Should You Seek Help for Abnormal Glucose in Ketosis?
Seek medical attention if your fasting glucose consistently exceeds 100 mg/dL (indicating loss of ketosis) or drops below 60 mg/dL (suggesting hypoglycemia risk). These levels often require professional evaluation. Monitoring for concerning symptoms along with glucose readings can help identify the exact time to intervene when it’s necessary.
Red flag glucose patterns:
-
Persistently high glucose readings
-
Dangerously low glucose readings
-
Extreme fluctuations
-
Sustained post-meal spikes
Symptoms requiring immediate attention:
-
Shaking
-
Sweating
-
Confusion
-
Rapid heartbeat
-
Dizziness
-
Excessive thirst
-
Frequent urination
-
Fatigue
-
Blurred vision
-
Nausea
-
Vomiting
-
Abdominal pain
-
Fruity breath odor
-
Chest pain
-
Severe headaches
These signs suggest hyperglycemia or hypoglycemia, ketoacidosis, and even cardiovascular issues. There are also special population that requires regular monitoring, including:
-
People with either type 1 or type 2 diabetes mellitus
-
Pregnant women
-
Elderly individuals
How to Use a Blood Glucose Level Chart for Ketosis?
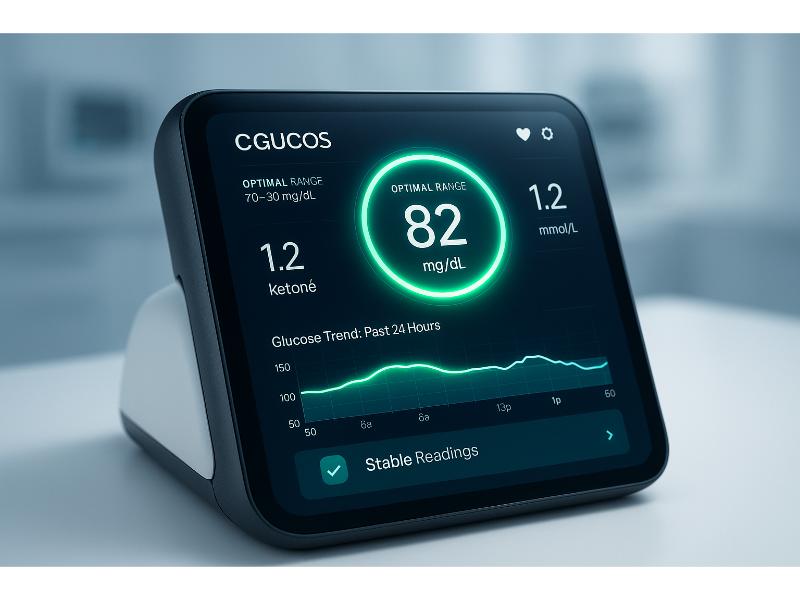
A blood glucose chart tracks your levels against ketone readings, showing the inverse relationship - aim for glucose 70-90 mg/dL with ketones 0.5-3.0 mmol/L for optimal ketosis performance. Daily logging reveals patterns that help you fine-tune your diet and lifestyle for better metabolic control.
Creating an effective tracking system involves recording multiple data points that influence your glucose levels. This comprehensive approach provides insights into how different factors affect your individual responses.
Essential chart components:
-
Date and Time
-
Glucose reading
-
Ketone level
-
Food intake (detailed)
-
Exercise or physical activity
-
Sleep quality
-
Stress level
-
Symptoms
Digital vs. paper tracking options:
-
Smartphone apps
-
Spreadsheet templates
-
Paper logs
-
CGM integration
You should review your charts on a weekly basis so that you can identify the trends and make informed and necessary adjustments. Look at correlations or relationships between specific foods, activities, or specific situations and your glucose readings.
What Does a Sample Glucose Chart Look Like?
An effective glucose chart displays clear columns for time, glucose readings, ketone levels, and relevant notes about food, exercise, and other factors influencing your measurements.
Sample daily tracking format:
|
Time |
Glucose (mg/dL) |
Ketones (mmol/L) |
Remarks |
|
06:00 AM |
75 |
1.2 |
Fasting Good sleep |
|
08:00 AM |
82 |
1.0 |
Post-coffee (black) |
|
10:00 AM |
78 |
1.3 |
Pre-workout |
|
12:00 PM |
85 |
0.9 |
Post-lunch Salad and Salmon |
|
03:00 PM |
80 |
1.1 |
Afternoon reading |
|
06:00 PM |
88 |
0.8 |
Post-dinner Broccoli and chicken |
|
09:00 PM |
76 |
1.4 |
Before bed |
This type of detailed tracking helps you identify which factors most significantly impact your glucose control and ketosis maintenance.
What Is the Glucose Ketone Index (GKI) and Why Is It Important?

The Glucose Ketone Index calculates the ratio between your glucose and ketone levels (converting glucose to mmol/L and dividing by ketones). You should aim for 3-9 for weight loss ketosis with values less than 3 suggesting therapeutic levels. This metric provides a more comprehensive assessment of metabolic efficiency than measuring glucose or ketones alone.
Factors affecting GKI calculations:
-
Timing of measurement
-
Individual variation
-
Medications
-
Exercise
How Can Diet and Lifestyle Maintain Levels?
Maintaining optimal glucose levels requires a comprehensive approach combining strict carbohydrate limitation, regular physical activity, stress management, and adequate sleep for sustained ketosis success.
Dietary strategies for glucose control:
-
Eat primarily fats and proteins
-
Practice intermittent fasting
-
Choose nutrient-dense foods
-
Monitor portion sizes
When Should You Worry About Blood Glucose Levels in Ketosis?
Worry if your fasting glucose consistently exceeds 100 mg/dL (indicating loss of ketosis) or drops below 60 mg/dL (suggesting hypoglycemia risk). You need to monitor for symptoms like dizziness, confusion, or excessive thirst. Persistent abnormal readings warrant medical consultation to rule out underlying conditions or medication adjustments.
Understanding the difference between normal ketosis fluctuations and concerning patterns helps you respond appropriately to glucose readings outside your target range.
Risk factors increasing monitoring needs:
-
Diabetes history
-
Heart disease
-
Kidney problems
-
Eating disorders
Quick Summary Box:
-
Optimal fasting blood glucose in ketosis ranges from 70-90 mg/dL.
-
Ketones and glucose have an inverse relationship; as glucose drops, ketones rise to 0.5-3.0 mmol/L for nutritional ketosis.
-
The Glucose Ketone Index (GKI) tracks ketosis depth, with a target of 3-9 for weight loss.
-
Glucometers and Continuous Glucose Monitors (CGMs) offer personalized insights for monitoring.
Related Resources
Understanding Fasting Glucose Levels: A Comprehensive Guide
Understanding Glucose in Urine: Causes, Symptoms, and Treatment
Blood Sugar Monitoring in Diabetes | Start Checking Your Blood Glucose
References
Berger, B., Jenetzky, E., Köblös, D., Stange, R., Baumann, A., Simstich, J., Michalsen, A., Schmelzer, K.-M., & Martin, D. D. (2021). Seven-day fasting as a multimodal complex intervention for adults with type 1 diabetes: Feasibility, benefit and safety in a controlled pilot study. Nutrition, 86, 111169. https://doi.org/10.1016/j.nut.2021.111169
GKI Levels: Calculate for Optimal Ketosis Benefits. (2022). Convertcalculator.com. https://www.convertcalculator.com/templates/gki/
Glucose Test. (n.d.). Ucsfhealth.org. https://www.ucsfhealth.org/medical-tests/blood-sugar-test
Holt, M. (2023, March 8). Glucose & Keto: What You Need to Know & Monitor. Www.nutrisense.io. https://www.nutrisense.io/blog/keto-blood-glucose
Moebus, S., Göres, L., Lösch, C., & Jöckel, K.-H. (2011). Impact of time since last caloric intake on blood glucose levels. European Journal of Epidemiology, 26(9), 719–728. https://doi.org/10.1007/s10654-011-9608-z
O’Neal, T. B., & Luther, E. E. (2019, January 30). Dawn Phenomenon. Nih.gov; StatPearls Publishing. https://www.ncbi.nlm.nih.gov/books/NBK430893/
Tinguely, D., Gross, J., & Kosinski, C. (2021). Efficacy of Ketogenic Diets on Type 2 Diabetes: a Systematic Review. Current Diabetes Reports, 21(9). https://doi.org/10.1007/s11892-021-01399-z
Venturini, C., Mancinelli, L., Giulia Matacchione, Olivieri, F., & Antonicelli, R. (2024). The Cardioprotective Effects of Nutritional Ketosis: Mechanisms and Clinical Implications. Nutrients, 16(23), 4204–4204. https://doi.org/10.3390/nu16234204
White, H., & Venkatesh, B. (2011). Clinical review: Ketones and brain injury. Critical Care, 15(2), 219. https://doi.org/10.1186/cc10020
Zahalka, S. J., Abushamat, L. A., Scalzo, R. L., & Reusch, J. E. B. (2023, January 6). The role of exercise in diabetes. PubMed; MDText.com, Inc. https://www.ncbi.nlm.nih.gov/books/NBK549946/
Zilberter, Y., & Zilberter, T. (2020). Glucose-Sparing Action of Ketones Boosts Functions Exclusive to Glucose in the Brain. Eneuro, 7(6), ENEURO.0303-20.2020. https://doi.org/10.1523/eneuro.0303-20.2020