What Is the Science Behind Ribbon Checkup Health Screening?
 Written By
Jaclyn P. Leyson-Azuela, RMT, MD, MPH

At-home urine tests are becoming a popular way to keep tabs on your health. If you are a proactive individual, the convenience of monitoring your kidney and liver health at home is an added layer of preventing major conditions.
This article explains the science behind Ribbon Checkup health screening. It is a system that uses test strips and a subscription-based app to analyze urine. We will uncover how the strips work, chemical reactions involved, and the role of AI when reading the results. You will also discover what health indicators are measured, how accurate the readings are, and ideally when to use them.
Key Insights
-
Ribbon Checkup uses color-based chemistry and AI to analyze 10 urine markers linked to kidney, liver, metabolic, and urinary health.
-
The test strip reactions create clear color shifts that the app compares against a printed color card to get consistent readings.
-
Results are meant for monitoring trends and prompting timely medical follow-up, not for diagnosis.
-
Good lighting, correct timing, and proper strip storage have a big impact on accuracy.
-
Regular, easy testing between appointments can help you notice changes sooner and talk with your clinician earlier.
What Is the Science Behind Ribbon Checkup?
The shorter answer is that Ribbon Checkup blends color change chemistry with phone-based AI to turn a strip’s colors into health insights.
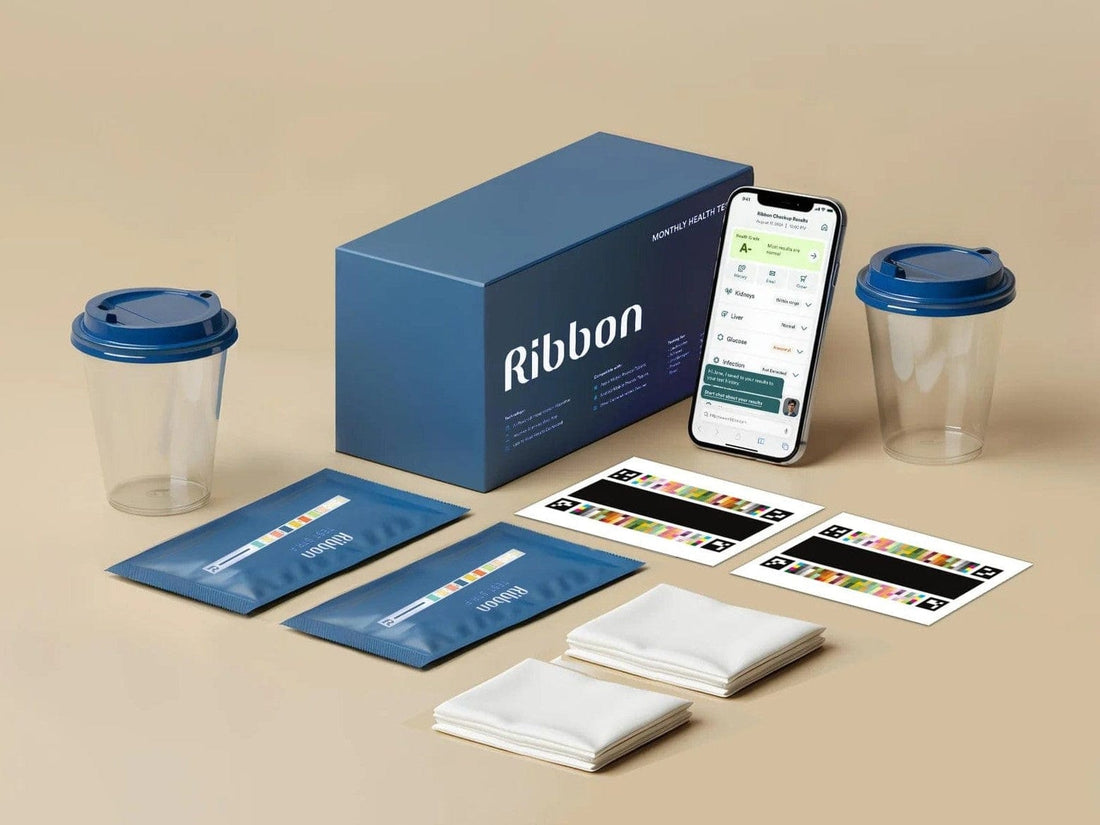
The heart of the system is colorimetric chemistry—meaning the reagents on small pads react with substances in urine and change color in predictable ways. The Ribbon Checkup app then analyzes the photo of the used strip alongside a printed color card, which compares the colors to known reference shades. Because it reads relative color against standard and not just what the camera sees, it can adjust for lighting and camera differences.
The result—a simple at-home process that turns a few minutes into meaningful easy-to-read information about your body.
This section sets the foundation for everything that follows. In the next section, we will discuss:
-
How the strips work
-
The chemical reaction behind each marker
-
How the app reads the results
-
Which markers matter for your health
-
How reliable the readings are
-
Ideally when to consider testing
How Do Urine Test Strips Work in Ribbon Checkup?

Here’s the quick answer: The pads on the test strips react to urine and shift in color. The app scans those colors against a color chart to measure your results.
-
Each strip includes multiple reagent pads, with each pad tuned to one marker only.
-
You dip the strip
-
Let the strip sit for the specified time (depending on the manufacturer)
-
Scan with the app
The procedure is intentionally simple so you can test at home without any special training. Because each strip targets one substance or biomarker, you get a panel of results in a single step. For people tracking a specific condition, that panel view helps you see a much broader picture, including:
-
Status of hydration
-
Kidney function
-
Signs that point toward infection
What Are the Basic Components of a Urine Test Strip?
A plastic backing holds small pads loaded with reagents, a printed card supplies color references for reading the results.
Specifically:
-
Absorbent pad squares that take up a small amount of urine and hold the reagents in place
-
Reagents are chemicals that react to specific substances or marker and change color
-
Printed color chart serves as a reference for the app to standardize the readings across lighting and camera types
These parts work harmoniously together to produce your much-needed results. For busy parents or anyone who is always short on time, the design makes a quick check possible—valuable during pregnancy, for instance, to check for proteins in the urine so you and your doctor can discuss possibilities or likelihood of pre-eclampsia sooner.
What Chemical Reactions Occur in Ribbon Checkup Tests?
Each pad uses a known reaction to turn invisible chemistry into visible color that the app can measure. The reactions are well-established in clinical screening. A few examples include:
-
Glucose
-
Protein
-
Ketones
-
Blood
-
Nitrites
These chemistry steps are selective, which helps reduce the reactions of other unrelated substances. When the app compares the final colors to the chart, it translates the shades into levels that you can understand at a glance.
How Does Ribbon Checkup Detect Glucose Levels?
The glucose pad uses enzymes that react with sugar and form a color. The deeper the color, the higher the amount of glucose is present in the sample.
Normally, urine contains little (undetectable) to no glucose. If the reading shows glucose, it can point to high blood sugar. The enzyme process, glucose oxidase followed by a color-forming step, creates a shade that the app reads in ranges. If you are monitoring your blood sugar trends, even the qualitative reading of urine test strips can prompt a medical discussion with your doctor.
How Does Ribbon Checkup Identify Protein in Urine?
A dye on the pad shifts color when protein is present, and deeper shades suggest higher amounts.
Protein in urine (otherwise known as proteinuria) can be an early sign that the kidneys need attention. Temporary spikes can happen after exercise or fever during an infection. But repeated positive results deserve a follow-up with your doctor.
If you’re pregnant, protein checks can support conversations about high blood pressure and preeclampsia risk. The apps’ consistent reading against a card helps you compare results across days and weeks.
How Does the Ribbon Checkup App Use AI for Analysis?

The app checks the strip and the color chart at the same time. Then, it calculates the levels for each marker. Including the color chart within a single image gives the app a standardized and fixed comparison so it is able to “learn” the true color under your own lighting.
An algorithm fine-tunes the readings. Thus, it compensates for warm lamps, daylight, or your phone camera’s settings. As a result, you’ll see a clean report with each marker labeled color bars or ranges for context, and plain language tips on what you can do next. For best results, shoot in bright, even light, lay the strip flat, and follow the timing window specified by the product label or packaging.
What Role Does the Color Chart Play in AI Analysis?
The card anchors the app's color algorithm so your results stay consistent and standardized despite variations in time testing and phone models or brand.
-
The chart includes a precise reference blocks that correspond to expected levels
-
The app aligns your strip’s color reaction with these blocks to reduce camera and lighting bias
-
The step involves reliability and helps make repeat testing more comparable next time
What Health Indicators Does Ribbon Checkup Measure?
Ribbon Checkup reads 10 markers: pH, glucose, protein, ketones, leukocytes, nitrites, blood, specific gravity, urobilinogen, and bilirubin. Each of these markers tell different stories about your body’s function. Together, they form a detailed view that may suggest patterns and trends worth discussing with your doctor.
|
Indicator |
What It Shows |
Why It Matters |
|
pH |
Acidity or Alkalinity |
Kidney stone risk, UTI patterns, metabolic balance |
|
Glucose |
Sugar in urine |
Possible high blood sugar, may prompt lab or clinic-based follow-up |
|
Protein |
Protein in urine |
Kidney stress or disease signals, pregnancy monitoring |
|
Ketones |
Fat breakdown products |
Diabetes management, fasting, low carb states |
|
Leukocytes |
White blood cells |
Inflammation or infection in urinary tract |
|
Nitrites |
Certain bacteria byproducts |
Supports a UTI suspicion when paired with leukocytes |
|
Blood |
Red blood cells or hemoglobin |
Stones, infection, or other urinary tract concerns |
|
Specific Gravity |
Urine concentration |
Hydration status, kidney concentrating ability |
|
Urobilinogen |
Bilirubin breakdown product |
Liver processing changes or red blood cell turnover |
|
Bilirubin |
Pigment from red blood cell breakdown |
Bile duct blockage or liver disease clues |

How Does Ribbon Checkup Monitor Kidney Function?
Protein and specific gravity give early, useful signals about how the kidneys are doing.
-
Repeated positive results suggest the filters in the kidneys allow protein to pass through (signals the time to call your physician)
-
Higher values of specific gravity indicate dehydration while consistently low values suggest that the kidneys are not concentrating well
-
Presence of blood and leukocytes alongside symptoms supports discussion about infection or kidney stones
Testing at home gives you a way to track these patterns sooner. If you see changes from your usual baseline, reach out to your care team.
How Does Ribbon Checkup Detect Liver Issues?
Bilirubin and urobilinogen trends point toward how the liver and bile system are working.
Elevated bilirubin levels in urine can signal that bile is not flowing normally as it should or that the liver is under some form of strain.
Urobilinogen changes can point to shifts in how the body breaks down red blood cells or how the liver processes the byproducts. While these screening clues can guide a medical discussion with your doctor, there are cases when further lab testing and imaging may be needed.
How Accurate Is Ribbon Checkup Compared to Lab Tests?
The readings are designed to match the accuracy of clinic-based screening tools closely. But they do not replace the full lab diagnostics. Ribbon Checkup uses medical standard reagents similar to those found in clinical grade dipsticks. Scanning against the color chart reduces the biggest driver of at-home testing variations—e.g., lighting or camera differences.
Many users find a strong match between app results and clinical screening when they test around the same time. But even so, at-home results remain best only for trend tracking and screening rather than using it for diagnostic purposes.
|
Strengths |
Considerations |
|
Fast, simple, convenient, and accessible at home |
Not a diagnostic test; lab confirmation may be needed |
|
Multi-marker panel in one dip |
Results can be affected by timing and technique |
|
App standardizes the color reading |
Some medicines or diets and hydration status affect the reading |
|
Helpful for identifying trends early |
Complex conditions still require clinical workup |
What Are the Limitations of Ribbon Checkup Accuracy?
Factors that can influence the results include:
-
Technique
-
Lighting
-
Timing
-
Storage
-
Hydration
-
Diet
-
Medicines
If results look off, repeat the test the next day while you follow the instructions closely and strictly. But when you’re in doubt or the results repeat, contact your doctor for medical advice.
When Should You Consider Using Ribbon Checkup?
Use Ribbon Checkup to monitor trends or track patterns between your doctor’s appointments. Or, you may also use it as timely feedback on key markers.
Common situations where at-home testing helps:
-
Managing underlying conditions—e.g., diabetes, kidney issues, or liver concerns
-
Pregnancy—e.g., monitoring for protein in urine in preeclampsia cases
-
Infection—e.g., along with symptoms, presence of leukocytes or nitrites may suggest infection
-
General wellness
-
Medication changes
-
Onset of new symptoms
Keep brief notes in the app or your health journal so you can share this with your clinician.

Practical Testing Tips for Reliable Results
These simple habits make your readings clearer and your trends easier to trust.
-
Read the label timing windows and set a phone timer so you scan at the right moment for each pad.
-
Rinse and dry a clean container before collecting a sample; avoid soap residue that could affect pH or other pads.
-
Hold the strip level after dipping so colors develop evenly without running between pads.
-
Take photos in bright, even light; avoid strong color casts from tinted bulbs or sunlight through colored curtains.
-
Place the color card right next to the strip in the same plane so both are lit the same way.
-
If you take vitamins high in vitamin C, test at a similar time of day to keep that variable steady.
-
Store strips in a cool, dry place with the cap tightly closed; don’t leave the bottle open while you test.
-
Check the expiration date; out‑of‑date reagents can give weak or misleading colors.
-
When results surprise you, repeat the test the next day before making decisions
These steps reduce the most common sources of variation at home. Consistency is what turns one reading into a dependable pattern.
Interpreting Trends and Talking With Your Clinician
Look for patterns over time and pair those with how you feel.
-
Track repeated positives: protein across several days, nitrites with symptoms, or shifting pH patterns that don’t match your usual diet.
-
Link notes to results: new medicines, strenuous workouts, dehydration during travel, or a new eating plan.
-
Watch combinations: leukocytes plus nitrites raise suspicion for a UTI; bilirubin plus dark urine and fatigue merits a call.
-
Compare to your baseline: a sudden change from your normal range can matter even if a single number looks ordinary.
-
Share visuals: screenshots from the app or a simple spreadsheet help your clinician see the whole picture quickly.
These conversations are easier when you bring clear notes. Your care team can then order lab tests or imaging as needed and guide next steps.
Conclusion
Ribbon Checkup brings lab-style screening to your home with a simple strip, a color card, and an app that reads colors reliably. The chemistry turns complex biology into clear shades; the app turns shades into levels you can understand. Used regularly, it helps you watch trends and decide when to reach out for medical advice. It’s a practical way to stay informed between appointments.
Quick Summary Box
-
Ten markers in one dip: pH, glucose, protein, ketones, leukocytes, nitrites, blood, specific gravity, urobilinogen, bilirubin
-
Color reactions plus a printed card keep readings steady across phones and lighting
-
Best for trend tracking and timely follow-up, not diagnosis
-
Accurate readings depend on timing, lighting, and proper storage
-
Great for monitoring chronic conditions, pregnancy, and general wellness.
Related Resources
At-Home Liver Tests: A Comprehensive Guide
Ribbon Checkup Urine Test: Simple At-Home Health Tracking
The Complete Guide to At-Home Kidney Function Tests
UTI Tests: The Essential Guide to Understanding and Managing Your Health
References
Admin. (2020, November 9). Colorimeter. BYJUS. Retrieved August 22, 2025, from https://byjus.com/chemistry/colorimeter/
Flaucher, M., Nissen, M., Jaeger, K. M., Titzmann, A., Pontones, C., Huebner, H., Fasching, P. A., Beckmann, M. W., Gradl, S., & Eskofier, B. M. (2022). Smartphone-Based colorimetric analysis of urine test strips for At-Home prenatal care. IEEE Journal of Translational Engineering in Health and Medicine, 10, 1–9. https://doi.org/10.1109/jtehm.2022.3179147
Haider, M. Z., & Aslam, A. (2023, September 4). Proteinuria. StatPearls - NCBI Bookshelf. Retrieved August 22, 2025, from https://www.ncbi.nlm.nih.gov/books/NBK564390/
Helen, L. S., Van Pelt, M. H., Bun, S., Daily, F., Neogi, T., Thompson, M., McGuire, H., & Weigl, B. H. (2018). Diagnostic accuracy of self-administered urine glucose test strips as a diabetes screening tool in a low-resource setting in Cambodia. BMJ Open, 8(3), e019924. https://doi.org/10.1136/bmjopen-2017-019924
Inagaki, K., Tsuriya, D., Hashimoto, T., & Nakamura, K. (2024). Verification of the reliability of an automated urine test strip colorimetric program using Colorimetric Analysis: a Quasi-Experimental Study (Preprint). JMIR Formative Research, 9, e62772. https://doi.org/10.2196/62772
Institute for Quality and Efficiency in Health Care (IQWiG). (2023, February 27). In brief: Understanding urine tests. InformedHealth.org - NCBI Bookshelf. Retrieved August 22, 2025, from https://www.ncbi.nlm.nih.gov/books/NBK279350/
Kim, H. J., Kim, M., Zhang, H., Kim, H. R., Jeon, J. W., Seo, Y., & Choi, Q. (2024). Artificial intelligence in diagnostics: Enhancing urine test accuracy using a mobile Phone–Based reading system. Annals of Laboratory Medicine. https://doi.org/10.3343/alm.2024.0304

Jaclyn P. Leyson-Azuela, RMT, MD, MPH, is a licensed General Practitioner and Public Health Expert. She currently serves as a physician in private practice, combining clinical care with her passion for preventive health and community wellness.


